Find the best estate agent near you Start here
January 19, 2018
4 minute read
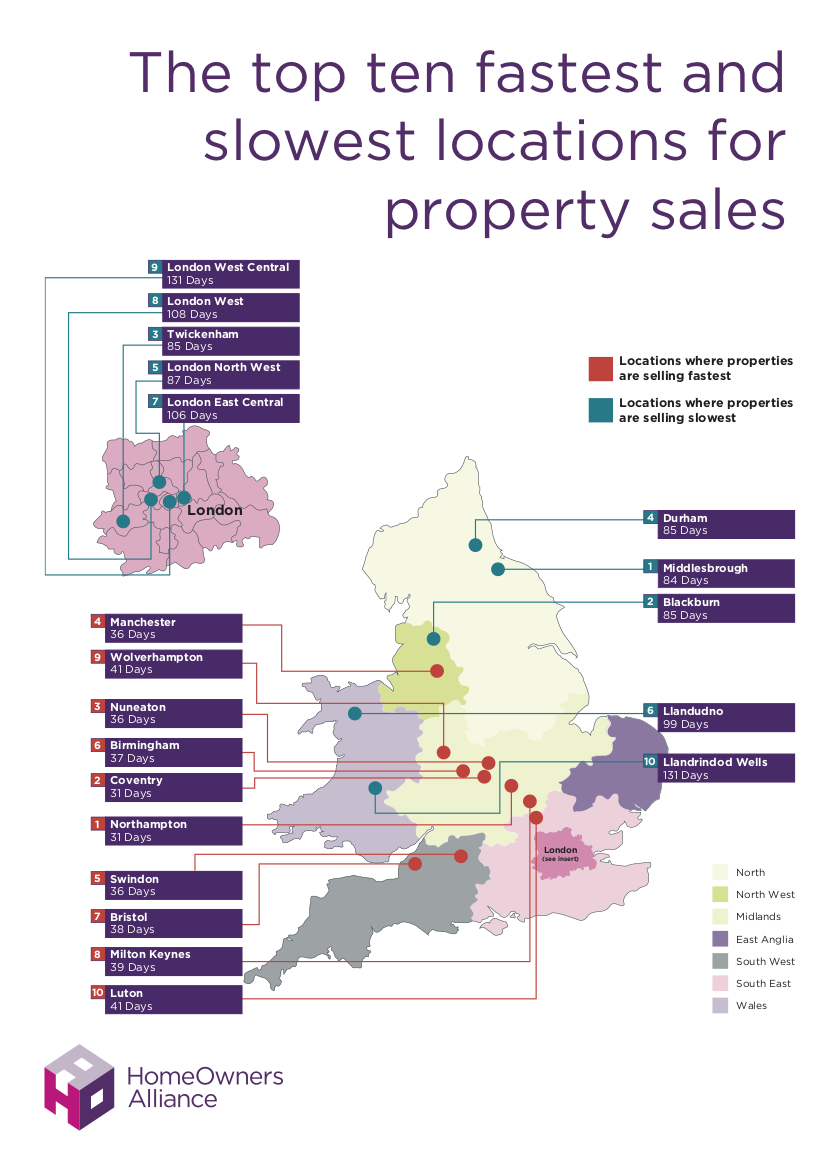
Northampton, Coventry and Manchester are the locations where homes are selling quickest, according to our analysis tracking the speed of the property market. The three towns lie in postcode areas where sales are typically agreed in less than 36 days – three times faster than some parts of London.
The research is based on searches conducted during December 2017 using the EstateAgent4ME tool here on the HomeOwners Alliance website. The analysis looked at how long thousands of houses and flats were listed on a property website before being marked as “under offer”.
Seven of the 10 postcode areas where homes are changing hands most quickly are in the Midlands. These hotspots include Birmingham, Milton Keynes, Wolverhampton, Luton and Stevenage.
The analysis provides further evidence of a slowdown in the London property market, with four of the 10 postcodes areas with the slowest sales either in or close to the capital. Three others in this slower group are in the North East: Durham, Middlesbrough and Sunderland.
Properties around West London are on average taking almost 108 days to go under offer – slower than any other postcode area.

Paula Higgins, Chief Executive of the HomeOwners Alliance, said:
“Knowing how long a sale can take is vital intelligence for anyone trying to sell their home. Our EA4ME tool gives homeowners a greater understanding of their local market and provides new insights into the state of the national picture. On a practical level, if selling your home fast is a priority, it means you can find, compare and rank your local estate agents according to ow quickly they sell a house like yours.
“Speed of sale isn’t the be all and end all – but it can mean all the difference between snapping up or missing out on the home of your dreams. Our free website lets anyone selling their home see which estate agents in their local area have the best track records for selling homes most quickly as well as closest to the initial asking price, alongside other important pieces of information to help you make an informed decision.”
| Rank | Postcode area | Postcode | Average days to sell a property |
| 1 | Northampton | NN | 30.6 |
| 2 | Coventry | CV | 31.3 |
| 3 | Manchester | M | 36 |
| 4 | Swindon | SN | 36.4 |
| 5 | Birmingham | B | 36.7 |
| 6 | Bristol | BS | 37.8 |
| 7 | Milton Keynes | MK | 39.3 |
| 8 | Wolverhampton | WV | 40.6 |
| 9 | Luton | LU | 40.8 |
| 10 | Stevenage | SG | 41.2 |
| Rank | Postcode area | Postcode | Average days to sell a property |
| 1 | London West | W | 107.9 |
| 2 | Llandudno | LL | 99.2 |
| 3 | London North West | NW | 87.4 |
| 4 | Durham | DH | 85.3 |
| 5= | Twickenham | TW | 84.9 |
| 5= | Blackburn | BB | 84.9 |
| 7. | Middlesbrough | TS | 83.7 |
| 8= | London South West | SW | 81.5 |
| 8= | Blackpool | FY | 81.5 |
| 10. | Sunderland | SR | 81.1 |
Postcode areas with fewer than 50 searches have been excluded from these tables.
Related Reads
This Homeowners Alliance research looks at how many days properties on average take before being marked as “under off”. As well as producing a national average figure of 60 days, we have broken down the data by more than 100 postcode areas in England and Wales.
We track the details of when homes are posted on all major property listing websites. The postcode area relates to the address of the estate agent advertising the property. We have therefore omitted transactions from online only estate agents in this research – which can have only one office.
We determine how long a sale takes by calculating each agents’ average time to reach a sale subject to contract for all properties advertised by this agent on websites during the previous 180 days.
Although not every property for sale is listed online, our samples are large. The data in this release was based on nearly 18,000 search results generated by the EstateAgent4Me service in December 2017.
Although all the searches were conducted during that month, these searches will include some agents’ performance data that may stretch back to June 2017.
Our research does not extend to Scotland or North Ireland. Our tables have excluded three postcode areas with fewer than 50 searches. These are: Llandindod Wells (LL), London East Central (EC) and London West Central (WC).
How our data can help homeowners
The complex statistical engine run by EstateAgent4Me is fed daily with property data from thousands of estate agents to provide accurate comparison data. The engine looks at key stats about the agents, including:
Their average success rate (how likely they are to sell a home) – this is determined by the percentage of all properties found advertised by this agent on websites during the last 180 days that were subsequently advertised as sold subject to contract.
Whether they achieve the asking price – this is calculated by dividing the sold price (as recorded at HM Land Registry) by the initial advertised asking price averaged for a representative sample of properties found advertised by this agent on websites during the previous 180 days.
How long, on average, it takes them to sell a property – this is determined by calculating each agent’s average time to reach sold subject to contract for all properties advertised by this agent on websites during the previous 180 days.
This data is then backed up with publicly available data from the Land Registry. For more information, see how the site work
 June 16, 2026
June 10, 2026
June 10, 2026
June 4, 2026
June 16, 2026
June 10, 2026
June 10, 2026
June 4, 2026