Find the best estate agent near you Start here
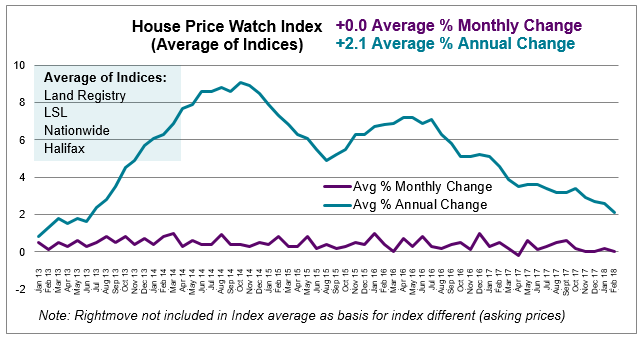
Nationally house prices are unchanged in the past month and average annual house price growth is 2.1%.
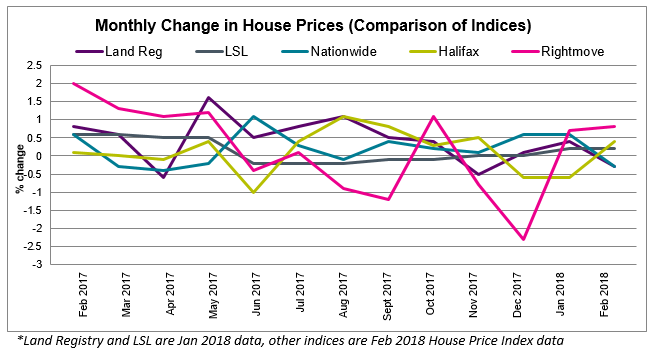
Rightmove (0.8%), Halifax (0.4%), and LSL (0.2%) report a rise in house price growth over the past month. Land Registry (-0.3%) and Nationwide (-0.3%) report a fall in house prices. Land Registry and LSL refer to January house price data. Nationwide, Halifax and Rightmove refer to February house price data.
Across the major indices, house prices are stable in the past month (0.0%) and have slowed to an average rate of annual growth of 2.1%. Rightmove is excluded from the average.
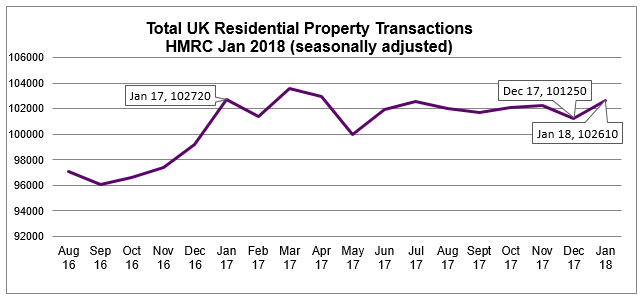
UK home sales are up 1.3% between December and January. Transactions are marginally lower than January 2017. They are 0.1% lower than the same month last year.
Mortgage approvals for house purchases, which are a leading indicator of completed house sales, rebounded in January. Mortgage approvals are up 9.4% month on month but are 2.4% lower than January 2017.
RICS reports a continuing decline in both new buyer enquiries and new instructions to sell over the past month. As a result, the stock of homes available for sale on estate agent books is further depleted.
Halifax: “Despite the November rise in the Bank of England Base Rate, mortgage rates continue to stay low by historical standards. While we expect price growth to remain low, the low mortgage rate environment, combined with an ongoing shortage of properties for sale, should continue to support house prices over the coming months.”
Rightmove: “The political and economic uncertainty is out of seller’s control, but they are in control of their asking prices, and in general they are not being overly ambitious or setting too high an asking price. This month’s rise of 0.8% is well below the 1.6% monthly average at this time of year over the last ten years, and it is wise for sellers to be cautious and not to over-price given stretched buyer affordability.”
RICS: “There is little change reported in headline prices. The indicators for future activity in the UK housing market remain subdued. New buyer enquiries, new instructions and newly agreed sales drift lower in February. There continue to be significant regional variations with new buyer enquiries up in Scotland, Northern Ireland, Yorkshire & Humber and down in London, the South East and the East Midlands. Alongside concerns about affordability in some areas of the country, part of the problem may lie in the lack of choice of properties to purchase.”
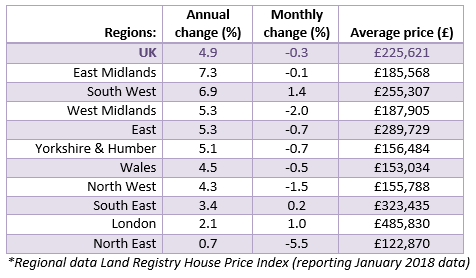
In the past month, house prices have risen in the South West (1.4%), London (1.0%) and the South East (0.2%). House prices have fallen in all other parts of the country.
Areas experiencing the highest annual house price growth include the East Midlands (7.3%) and the South West (6.9%).
Annual house price growth is slowest in the North East (0.7%) and London (2.1%).
To see how we calculate our House Price Watch click here and to see previous reports click here
HomeOwners Alliance Ltd is registered in England, company number 07861605. Information provided on HomeOwners Alliance is not intended as a recommendation or financial advice.
HomeOwners Alliance Ltd is an Introducer Appointed Representative of Mortgage Advice Bureau (Derby) Limited which is authorised and regulated by the Financial Conduct Authority.
HomeOwners Alliance Ltd is an Introducer Appointed Representative (IAR) of LifeSearch Limited, an Appointed Representative of LifeSearch Partners Ltd, authorised and regulated by the Financial Conduct Authority. (FRN: 656479).
Independent Financial Adviser service is provided by Unbiased, who match you to a fully regulated, independent financial adviser, with no charge to you for the referral.
HomeOwners Alliance Ltd is an Introducer Appointed Representative (IAR) of Fluent Money Limited, which is authorised and regulated by the Financial Conduct Authority. Calls may be monitored/recorded.
