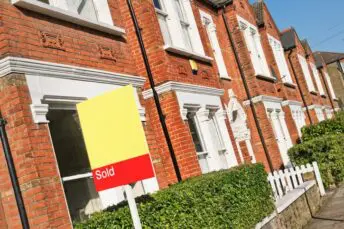
House Price Watch Aug 2021
House prices fell this month for the first time in a year. Similarly, transactions were at their lowest level in 12 months after record activity in June which coincided with the main stamp duty holiday coming to an end. There continues to be a shortage of properties available for sale and, though there are early signs of buyer demand softening, it remains a sellers market with properties for sale being snapped up quickly.
What’s happening nationally
House prices fall for the first time in 12 months. House prices are down on average -0.3% in the past month and are up +8.7% in the past year.
Indices based on:
Land Registry – registered property transactions in July.
Nationwide & Halifax – mortgage valuations in August.
Rightmove – asking prices posted on Rightmove in August.
*Rightmove is not included in the index average as the basis for its index is different (asking price vs agreed sale price)
| Index reports: | Monthly change | Annual change |
|---|---|---|
| Land registry | -3.7% | +8.0% |
| Nationwide | +2.1% | +11.0% |
| Halifax | +0.7% | +7.1% |
| Rightmove | -0.3% | +5.6% |
| Average change | -0.3% | +8.7% |
House prices in your area
While house prices fell in most areas over the past month, annual house prices have increased in all UK regions, with the highest rises over the past year in Scotland (+14.6%), Wales (11.6%) and the North East (+10.8%).
London (+2.2%) and the Southwest (5.2%) regions have experienced lower levels of annual house price inflation than other areas.
| UK Region | Average price £ | Monthly change | Annual change |
|---|---|---|---|
| England | |||
| Nothern Ireland | |||
| Scotland | |||
| Wales | |||
| North West | |||
| Yorkshire and The Humber | |||
| North East | |||
| West Midlands | |||
| East Midlands | |||
| South West | |||
| East of England | |||
| South East | |||
| London |
| UK City | Average price | Annual change |
|---|---|---|
Market Monitor
Lowest level of transactions for 12 months.
Buyer demand starting to soften.
Housing stock further depleted as new seller instructions decline over the past month.
Seller’s market continues with time to sell reducing further.
How busy is the market?
- Not busy
- Normal
- Very busy
- Transactions lowest in 12 months
- Total number of transactions in July 74K
- -63% from last month
- +4% higher than July last year
Homes for sale vs homebuyers
- Good availability of homes
- Normal
- Shortage of homes
- Buyer enquiries down (-14% RICS); second month in a row
- Seller enquiries down (-37% RICS); fifth month in a row
- Average stock per agent 50; lowest stock in 7 months (incl under offer/ Sold STC Rightmove)
Average speed of sale
- Fast
- Normal
- Slow
- 36 days to find a buyer down from 38 days last month (12 month average 50 days Rightmove)
What the experts say
Rightmove

“New sellers dropping their asking prices can ring economy alarm bells, especially when it’s the first time so far this year, so it’s important to dig underneath the headline figures. Our analysis shows that average prices have only fallen in the upper-end sector, which is usually more affected by seasonal factors such as summer holidays and has also seen the greatest withdrawal of stamp duty incentives. The mass-market of properties that cater for first-time buyers and second-steppers is still seeing high demand and upwards price pressure leading to new record high average prices in those sectors.”
Nationwide

“Underlying demand is likely to remain solid in the near term. Consumer confidence has rebounded in recent months while borrowing costs remain low. This, combined with the lack of supply on the market, suggests continued support for house prices. But, as we look towards the end of the year, the outlook is harder to foresee. Activity will almost inevitably soften for a period after the stamp duty holiday expires at the end of September, given the incentive for people to bring forward their purchases.”
Halifax

“Much of the impact from the stamp duty holiday has now left the market, as highlighted by the drop in industry transaction numbers compared to a year ago. However, while such Government schemes have provided vital stimulus, there have also been other significant drivers of house price inflation. Structural factors have driven record levels of buyer activity – such as the demand for more space amid greater home working. These trends look set to persist and the price gains made since the start of the pandemic are unlikely to be reversed once the remaining tax break comes to an end later this month.”
Zoopla

“The lower supply of homes listed for sale may lead to a natural slowing in buyer interest, albeit from high levels. A return to more normal levels of market activity will result in a slow rebuilding of stock through 2022.”
RICS

“August 2021 RICS Residential Survey results point to a slight softening in activity over the month, with the market seemingly taking a breather following the surge in sales recorded prior to the phasing out of the Stamp Duty holiday. Nevertheless, activity is expected to stabilise in the near team with a modestly positive trend returning over the twelve month time horizon.”


