Find the best estate agent near you Start here
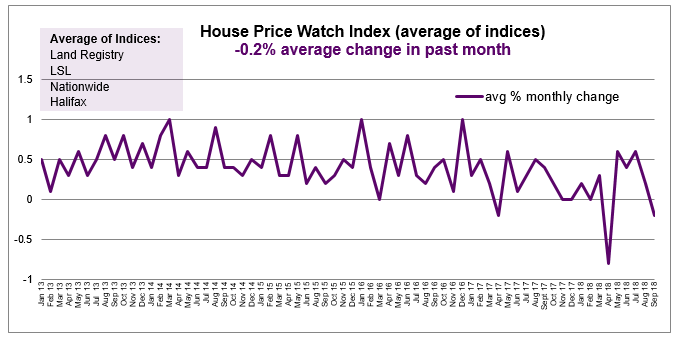
House prices have fallen on average (-0.2%) based on the average of the major indices. This is the second time in 2018 house prices are down; the first since April of this year.
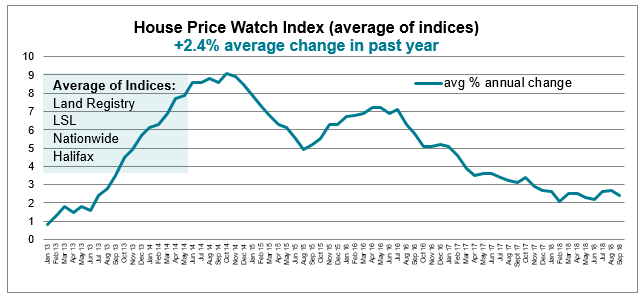
Average annual house price growth slowed slightly from the previous month to (2.4%). The annual rate of house price growth has remained within the fairly narrow band of 2.1%-2.7% in 2018.
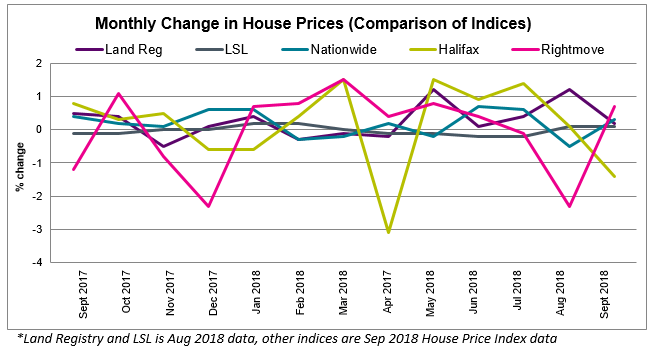
Note: Rightmove is not included in the average of indices calculation as the basis for its house prices is different (asking prices).
Land Registry and LSL refer to August data. Other indices refer to September house price data.
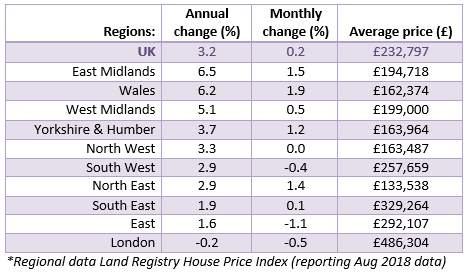
Regions with the biggest annual change in house prices include: The East Midlands (+6.5%), the West Midlands (+5.1%) and Wales (6.2%).
London (-0.2%), the East of England (1.6%) and the South East (1.9%) have the slowest rates of annual house price growth. London is the only region to have experienced a fall in house prices over the past year.
Buyer demand fell in August and again in September. At the same time, the number of new sales instructions coming to the market deteriorated for the second month running. This leaves average stock levels on estate agents’ books close to record low levels. Limited choice could be a factor hampering demand. The average time to agree a sale is also increasing. The time taken to complete a sale from initial listing has increased to 19 weeks. (Source: RICS UK Residential Market Survey – Sept 2018)
HomeOwners Alliance: “Overall activity and house price growth remains subdued. Buyer demand and new seller enquiries are down for the second month running. However, the market continues to reflect a varied picture regionally. The Midlands and Wales are experiencing the fastest pace of house price growth and London, the East and the South East are experiencing the slowest rates of growth.”
Rightmove: “Buyer affordability ratios were not stretched to the same degree in the Midlands and the North than they were in the South, with a comparatively modest average price increase of 21% since 2011. That’s left some price momentum fuel still in the tank in these regions, and means that the current momentum has the mileage to carry on into this Autumn. That compares to the seven-year 40% plus price binge seen in London and its commuter belt neighbours of the South East and East of England, which is the cause of their current indigestion.”
RICS: “There are a number of themes running through the comments of respondents this month but uncertainty relating to Brexit negotiations is at the very top of the list followed by references to the confidential remarks made by the Bank of England Governor to the cabinet. All of this is not surprisingly taking its toll on the sales market with the key activity indicator flat or slightly negative in all parts of the country apart from Northern Ireland and Wales. The recent announcement that the Housing Revenue Account borrowing cap will be abolished is a bold move. There is no silver bullet that will immediately resolve this problem [challenges facing those looking to buy or rent property] but encouraging new entrants to deliver affordable homes is certainly part of the answer.”
Halifax: “With the annual rate of house price growth easing in September, we are seeing a steadying in house price inflation. This is set amongst mortgage approvals and completed house sales remaining broadly unchanged. The annual rate of growth is near the top of our forecast range for 2018 as a low supply of new homes and existing properties for sale, combined with historically low mortgage rates and a high employment rate, continue to support house prices.”
Nationwide: “Annual house price growth was stable in September. Indeed, annual house price growth has been confined to fairly narrow range of 2-3% over the past 12 months, suggesting little change in the balance between demand and supply in the market. Subdued economic activity and ongoing pressure on household budgets is likely to continue to exert a modest drag on housing market activity and house price growth this year, though borrowing costs are likely to remain low.”
To see how we calculate our House Price Watch click here and to see previous reports click here
HomeOwners Alliance Ltd is registered in England, company number 07861605. Information provided on HomeOwners Alliance is not intended as a recommendation or financial advice.
HomeOwners Alliance Ltd is an Introducer Appointed Representative of Mortgage Advice Bureau (Derby) Limited which is authorised and regulated by the Financial Conduct Authority.
HomeOwners Alliance Ltd is an Introducer Appointed Representative (IAR) of LifeSearch Limited, an Appointed Representative of LifeSearch Partners Ltd, authorised and regulated by the Financial Conduct Authority. (FRN: 656479).
Independent Financial Adviser service is provided by Unbiased, who match you to a fully regulated, independent financial adviser, with no charge to you for the referral.
HomeOwners Alliance Ltd is an Introducer Appointed Representative (IAR) of Fluent Money Limited, which is authorised and regulated by the Financial Conduct Authority. Calls may be monitored/recorded.
