Find the best estate agent near you Start here
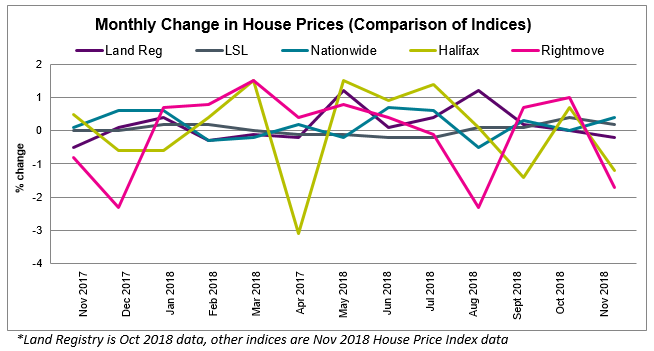
The major indices report the following changes in house prices over the past month:
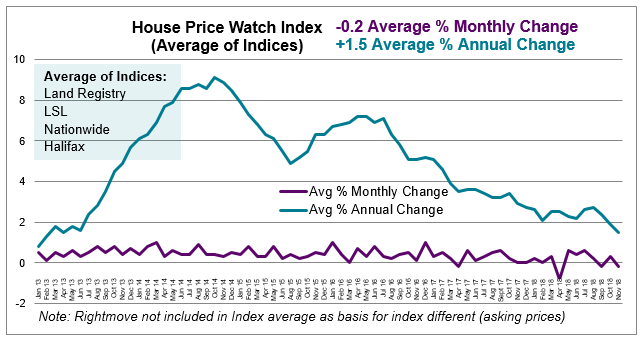
Across the major indices, house prices are down on average -0.2% in the past month. The average rate of annual house price growth slows to (1.5%). This is the slowest rate of average annual house price growth since February 2013. (Rightmove is excluded from the average).
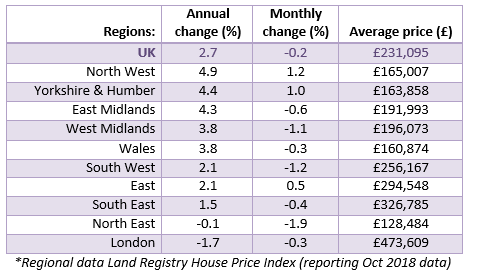
Apart from North West, Yorkshire & Humber and East of England, most regions experienced a fall in house prices this month.
Regions with the biggest annual rise in house prices include: The North West (4.9%), Yorkshire & Humber (4.4%) and the East Midlands (4.3%).
This year house prices are down in London (-1.7%) and the North East (-0.1%).
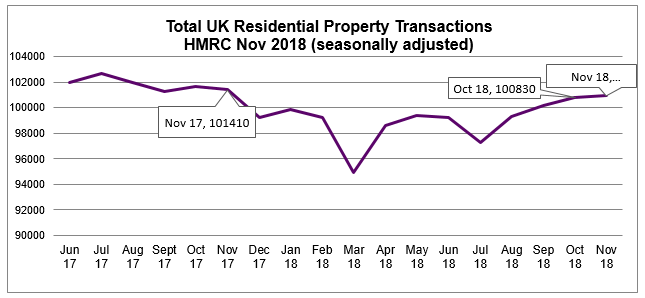
The seasonally adjusted estimate of the number of residential property transactions increased by 0.1% between October 2018 and November 2018. This month’s seasonally adjusted figure is 0.5% lower compared with the same month last year. (HMRC Seasonally adjusted residential property transactions)
Demand has fallen now for four successive months and new seller instructions have fallen for the fifth consecutive month. November was the slowest month in new sales listings for twenty-eight months. As a result, average stock levels on estate agents’ books remains close to record lows. The time to complete a sale is also slowing – on average 19 weeks (the slowest since Feb 2017). Uncertainty caused by Brexit and a lack of fresh homes available for sale are seen to be impeding overall activity. (RICS Nov, 2018 UK Residential Market Survey)
HomeOwners Alliance: “On a national level, the annual rate of house price growth continues to slow – to the lowest level seen in close to five years. Transactions have stagnated with little change between October and November. Both buyers and sellers are cooling amidst the current climate of political and economic uncertainty. Still, there are pockets of the country where house prices are climbing rapidly – notably the North West.”
RICS: “The November 2018 RICS UK Residential Market Survey results are consistent with a weaker trend in sales market activity with headline indicators on both demand and supply edging further into negative territory. Furthermore, forward looking metrics suggest that momentum is likely to continue slipping in the coming three months, although a somewhat stable trend is expected to emerge further out.”
Nationwide: “In the near term, the squeeze on household budgets and the uncertain economic outlook is likely to continue to dampen demand, even though borrowing costs remain low and the unemployment rate is near 40-year lows. If the uncertainty lifts in the months ahead and employment continues to rise, there is scope for activity to pick-up through next year. Interest rates are only expected to rise at a modest pace and to a limited extent in the years ahead. The housing supply picture has improved. After falling by almost 60% in the wake of the financial crisis, there has been a significant pick up in construction in recent years. New build completions in England n 2017/18 reached 195,300, around 3% below 2007/08 levels.”
Rightmove: “New sellers and their agents are reacting to market forces and lowering their pricing aspirations by more and sooner than usual. They have acted early to try to improve the buying mood and avoid the traditional ‘buyer humbug’ dislike of Christmas housing activity.”
To see how we calculate our House Price Watch click here and to see previous reports click here
HomeOwners Alliance Ltd is registered in England, company number 07861605. Information provided on HomeOwners Alliance is not intended as a recommendation or financial advice.
HomeOwners Alliance Ltd is an Introducer Appointed Representative of Mortgage Advice Bureau (Derby) Limited which is authorised and regulated by the Financial Conduct Authority.
HomeOwners Alliance Ltd is an Introducer Appointed Representative (IAR) of LifeSearch Limited, an Appointed Representative of LifeSearch Partners Ltd, authorised and regulated by the Financial Conduct Authority. (FRN: 656479).
Independent Financial Adviser service is provided by Unbiased, who match you to a fully regulated, independent financial adviser, with no charge to you for the referral.
HomeOwners Alliance Ltd is an Introducer Appointed Representative (IAR) of Fluent Money Limited, which is authorised and regulated by the Financial Conduct Authority. Calls may be monitored/recorded.
