Find the best estate agent near you Start here
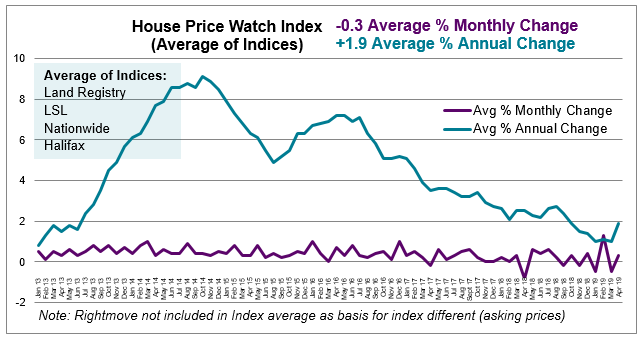
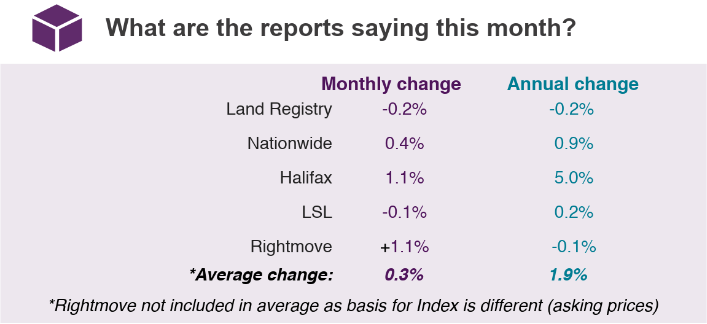
Land Registry refers to March data. Other indices refer to April house price data. Rightmove is excluded from the average as the basis for the index is different (asking prices).
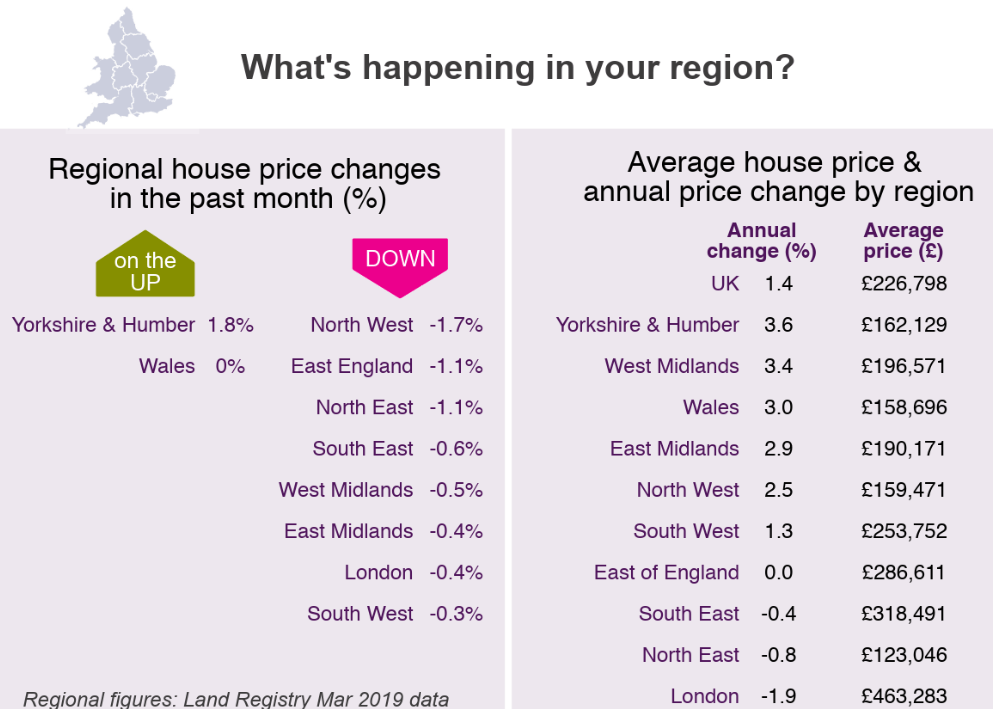
House prices are down in most regions this month: The North West (-1.7%), East of England (-1.1%), North East (-1.1%), South East (-0.6%), West Midlands (-0.5%), East Midlands (-0.4%), London (-0.4%), South West (-0.3%). They are steady or up in: Yorkshire & Humber (+1.8%), Wales (0%)
House prices are up over the past year in: Yorkshire & Humber (+3.6%), the West Midlands (+3.4%), East Midlands (+2.9%), Wales (+3.0%), the North West (+2.5%) and the South West (+1.3%).
HomeOwners Alliance says: “Overall house price growth and market activity has yet to see its spring bounce. Buyer and seller confidence remains decidedly cool as uncertainty about Brexit and the economy lingers. But, the balance seems to have tipped for the first time in years in favour of buyers and first-time buyer numbers are reported to be climbing. Regionally, there is a varied picture with annual house prices continuing to rise in many areas outside London and the South East.”
Rightmove says:“It is usual for properties coming to the market at this time of year to see a price rise as the spring moving season gets under way. Some sectors of the market and some parts of the country have strong buyer demand and a lack of suitable supply. However, on average, properties are still coming to the market at slightly lower prices than a year ago. It’s one of the most price-sensitive markets that we’ve seen for years, with buyers understandably looking for value or for homes with extra quality and appeal that suit their needs.”
Nationwide says: “UK house price growth remained subdued in April. While the ongoing economic uncertainties have clearly been weighing on consumer sentiment, this hasn’t prevented further steady gains in the number of first time buyers entering the housing market. The number of mortgages being taken out by first time buyers has continued to approach pre-financial crisis levels. While house prices remain high relative to average earnings, low mortgage rates have helped to support mortgage affordability. Raising a deposit appears to be the major barrier for prospective first time buyers, since the cost of servicing the typical mortgage remains in line with or below long-run averages as a share of take home pay in most regions.”
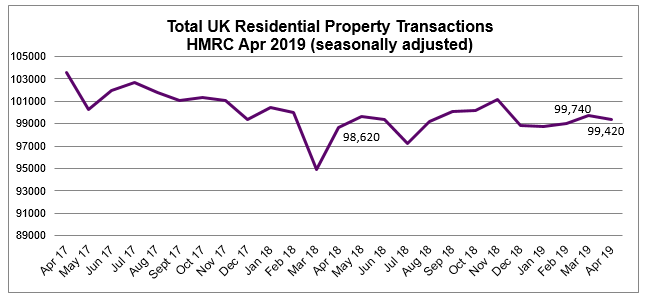
Home sales dipped 0.3% between March and April 2019, but are up slightly year on year — 0.8% higher than April 2018 (HMRC Seasonally adjusted residential property transactions)
The sustained fall in new buyer enquiries is a key factor underlying weaker price trends. Demand is down again this month. This has been matched by a sharp decline in new sales instructions. The subsequent lack of stock on the market is giving buyers limited choice and is seen to be holding back activity. (RICS Apr 2019 UK Residential Market Survey).
RICS says: “Results point to overall market trends remaining very similar to those reported in recent months, with headline indicators on demand, supply and prices all still stuck in negative territory. Brexit uncertainty and a lack of available stock to purchase remain the key constraints, meaning little change in momentum is anticipated in the near term.”
Halifax says: “Demand and supply of housing remained subdued for another month. The index has seen a weaker pace of growth over the last three years, which is consistent with the easing of transaction volumes and housing market activity reflected in RICS, Bank of England and HMRC figures. Looking further back, this April marks 10 years since the lowest point of the Halifax house price index following the financial crash in 2008. Over the past decade annual house price growth has seen an average rise of 4.3% each year.”
To see how we calculate our House Price Watch click here and to see previous reports click here
HomeOwners Alliance Ltd is registered in England, company number 07861605. Information provided on HomeOwners Alliance is not intended as a recommendation or financial advice.
HomeOwners Alliance Ltd is an Introducer Appointed Representative of Mortgage Advice Bureau (Derby) Limited which is authorised and regulated by the Financial Conduct Authority.
HomeOwners Alliance Ltd is an Introducer Appointed Representative (IAR) of LifeSearch Limited, an Appointed Representative of LifeSearch Partners Ltd, authorised and regulated by the Financial Conduct Authority. (FRN: 656479).
Independent Financial Adviser service is provided by Unbiased, who match you to a fully regulated, independent financial adviser, with no charge to you for the referral.
HomeOwners Alliance Ltd is an Introducer Appointed Representative (IAR) of Fluent Money Limited, which is authorised and regulated by the Financial Conduct Authority. Calls may be monitored/recorded.
