Feb 2017 House Price Watch
Feb 2017 House Price Watch indicates house prices are up on average 0.3% in the past month and up on average 5.1% in the past year
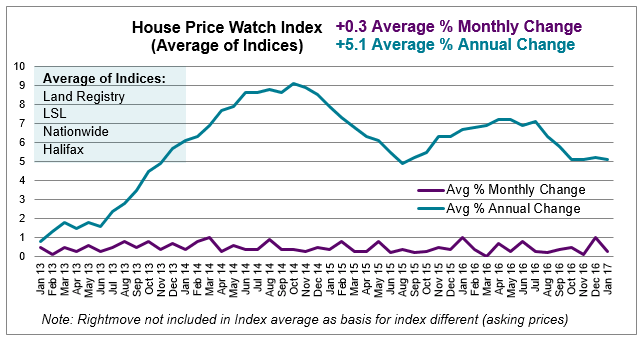
2017 begins with rise in activity and modest increase in house prices
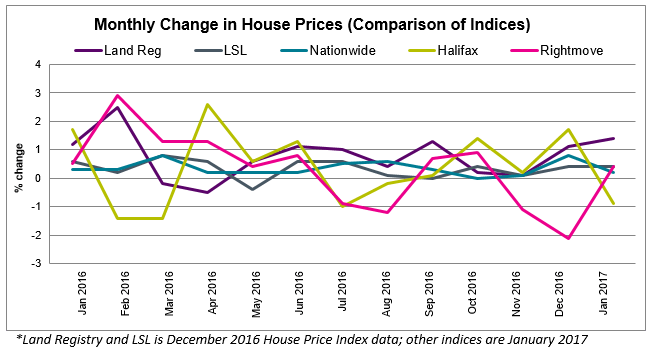
Most of the major House Price Indices report house prices to be up in the past month: -0.9% Halifax, +0.2% Nationwide, +0.4% LSL, +1.4% Land Registry (the average monthly change across Land Registry, Nationwide, Halifax and LSL is 0.3%). Rightmove, report a rise of 0.4% in asking prices in January. Land Registry and LSL data refers to December. All other indices are reporting January figures.
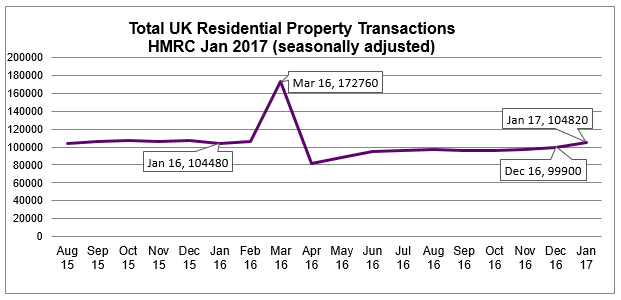
UK home sales continue to rise — up 4.9% between December and January, 0.3% higher than the same month last year (HMRC seasonally adjusted figures).
Mortgage approvals for house purchases, a leading indicator of completed house sales, increased for the fourth successive month, up 1% between November and December 2016 to 67,900 — the highest level since March 2016 (Bank of England).
Halifax First Time Buyer review reports first-time buyer numbers up 7% in 2016 — the highest level since the start of the financial crisis in 2007 (still 17% below pre-crisis peak).
Supply remains tight with RICS reporting new sales instructions down in January leaving the stock of homes available for sale further depleted.
Transactions increase in January but climate is cautious and buyers price sensitive
Outlook for 2017:
HOA: “Despite ongoing political and economic uncertainty, transaction activity has held strong. House price rises have been modest and it is likely homeowners and prospective buyers will keep a watchful eye as the political and economic situation develops with the triggering of article 50 and subsequent negotiations.”
Nationwide: “The outlook for the housing market remains clouded, reflecting uncertainty surrounding economic prospects more broadly. On one hand, the economy has remained stronger than expected in the wake of the Brexit vote. However, there are tentative signs that conditions may be about to soften. Employment growth and wage growth has slowed.”
Halifax: “UK house prices continue to be supported by an ongoing shortage of property for sale, low levels of house building, and exceptionally low interest rates. These factors are unlikely to materially change during 2017.”
Rightmove: ““The majority of the market is price sensitive with most agents we surveyed reporting that possible buyers are reluctant to enquire about a property just a few percent too high in price.”
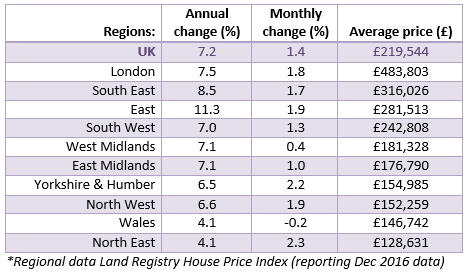
Regional Summary
Regionally, house prices up across the board (December Land Registry data). Largest monthly rises evident in the North East and Yorkshire & Humber. Annual house price growth highest in East of England (+11.3%) and South East (+8.5%).
Prefer pictures, see our Infographic
To see how we calculate our House Price Watch click here and to see previous reports click here
Share this page:
Find and compare the best high street estate agents in your local area