Dec 2016 House Price Watch
Dec 2016 House Price Watch indicates house prices are up on average 0.1% in the past month and up on average 5.1% in the past year
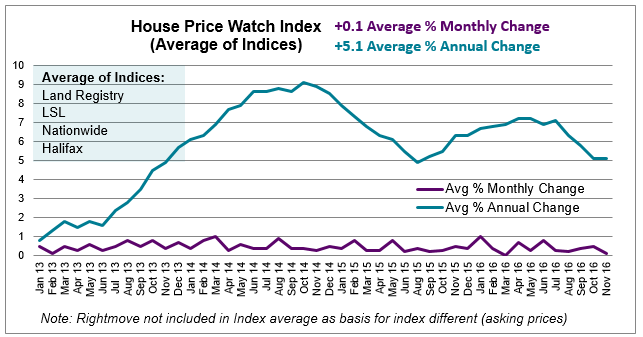
Annual house price growth stable; activity picks up
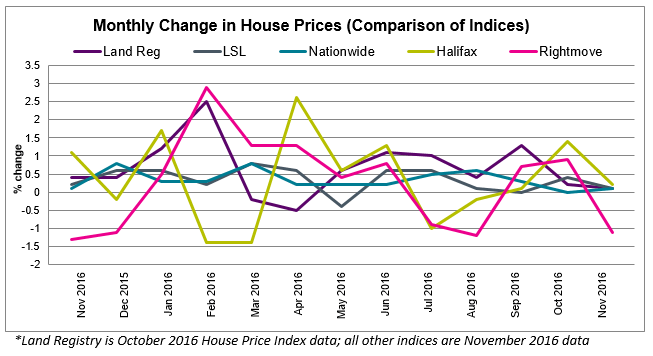
The major House Price Indices generally report house prices to be up very slightly in the past month ranging from a low of 0.1% change in house prices from Land Registry, Nationwide and LSL to a high of 0.2% from Halifax (the average change across Land Registry, Nationwide, Halifax and LSL is 0.1%). Rightmove, report a fall of -1.1% in asking prices in November.
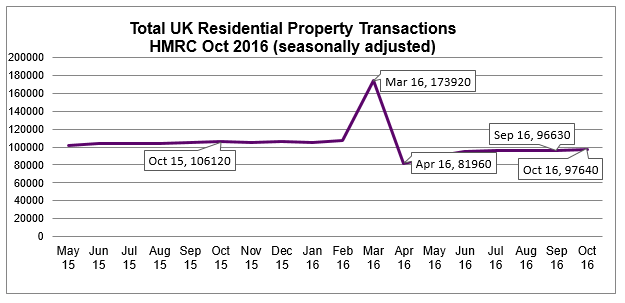
UK home sales edged upwards in the past month — up 1% between September and October, although 8% lower than the same month last year (HMRC seasonally adjusted figures). Transactions have been below 2015 levels since the surge in sales in March (ahead of stamp duty changes on second homes).
Signs buyer demand is strengthening
Mortgage approvals for house purchases, a leading indicator of completed house sales, increased for the second successive month, rising by 6% between September and October (Bank of England).
RICS also reports that buyer demand has edged upwards for the third consecutive month.
Supply remains tight and could be a brake on activity
Homes available for sale is at record low according to RICS with no increase in stock for 9 months. Rightmove say that new listing numbers are up by just 2% and available stock for sale per agent is down 5%.
However, new homes completions and starts are reported to be up; completions in Q3 2016 are up 7% and new starts in Q3 2016 are up 9% on the same period in 2015.
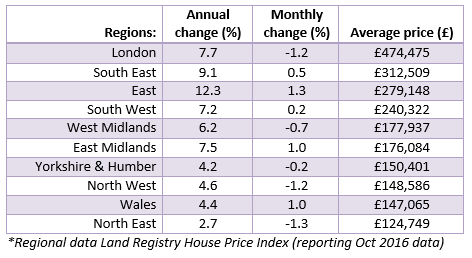
Regional Summary
House prices have fallen in a number of regions
The biggest fall in house prices in the past month was in the North West (-1.3%), the North East (-1.2%) and London (-1.2%).
London has seen a marked slowdown since June (dropping from 13.8% to 7.7%) annual growth. LSL analysis suggests the drop in London house prices is occurring in prime central London where four out of five of the most expensive areas saw prices fall in the last month.
Prefer pictures, see our Infographic
To see how we calculate our House Price Watch click here and to see previous reports click here
Share this page:
Find and compare the best high street estate agents in your local area