Housing market post Brexit
Online estate agents eMoov.co.uk examine month-by-month housing data following Brexit to see where the market is headed.
August 30, 2017
It’s no secret that property price growth across the UK market has been subdued since the Brexit vote. In fact, across the UK the average house price has risen on average by just 0.37% a month since the decision to leave the EU.
But despite positive growth having been reported over the last few months, latest research by leading online estate agent, eMoov.co.uk, has highlighted that even if the market continues stalling (ie rising by only 0.37% a month), the average UK house would still hit £347,757, an increase of 56% over the next decade – not exactly a poor return for UK home buyers.
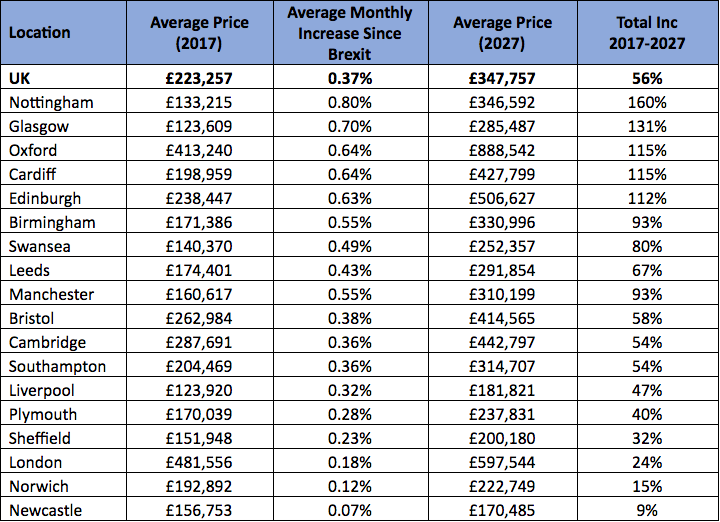
Below eMoov’s latest research looks at 18 major UK cities to see where is the best bet for the largest house price increase, based on monthly growth since last June.
Top Five of 18 Major Cities by Price Increase
London has seen a real slowdown in price growth since Brexit and so although the capital would still be one of the most expensive cities in the UK (along with Oxford), it would have seen one of the lowest percentage increases in value.
- Nottingham is top of the table in terms of monthly prices growth since Brexit, up 0.80% a month on average meaning the average house price would increase 160% from the current £133,215 to £346,592 by 2027
- Glasgow has increased by a notable 0.70% a month since June of last year, the second highest across the UK. If this subdued monthly growth continues the Scottish city will see prices hit £285,487 by 2027, a jump of 131%.
- Oxford ties with fourth place Cardiff with an average monthly increase of 0.64% in the last year. As a result, the city would see its already expensive current cost of property (£413,240) jump £115% to an eye watering £888,542 by 2027.
- Cardiff flies the flag for Wales and the monthly growth of 0.64% going forward would again result in an increase of 115% and a new average house price of £427,799 by 2027.
- Edinburgh, Scotland’s capital and its second entry in the top five has seen prices increase by a monthly average of 0.63% since June 2016. The same slower rate of growth over the next decade would still see prices exceed half a million (£506,627), an increase of 112%.
Bottom Three of 18 Major Cities by Smallest Growth
Even those that have seen some of the smallest monthly price growth since Brexit would still be in for some return on their investment, albeit smaller than elsewhere across the UK.
- Newcastle is the city to have seen the smallest growth since Brexit, up just 0.07% on average each month since June 2016. The average house price in the north-east city is now £156,753 and although the same minimal monthly growth would only see a 9% increase over the next 20 years, a jump of £13,731 to £170,485 is still better than nothing.
- Norwich has surprisingly seen the second lowest rate of monthly growth at 0.12% since Brexit. But this is still enough to see a 15% jump to £222,749 over the next ten years from the current average of £192,892.
- London homeowners have seen an average monthly increase of just 0.18% since June last year, but this is still enough to push prices to a huge £597,544 over the next ten years, making it the second most expensive city despite the lower rate of growth (24%).
Founder and CEO of eMoov.co.uk, Russell Quirk, commented:
“With latest industry figures indicating an end to the post-Brexit market slowdown that has seemingly plagued the market over the last 18 months, many UK homeowners will be breathing a sigh of relief, despite having still enjoyed a notable annual increase in their property’s value.
Although these recent slower rates of price growth are unlikely to persist going forward, and we are by no means predicting they will, this research demonstrates that the outlook would still be rather positive and far from the apocalyptic prophecy’s many have talked the market down with since the Brexit vote.”
How is this calculated?
- eMoov took the month on month price data, including the percentage increase.
- They then took an average across the monthly percentage increases from June 2016. to June 2017 (the latest Land Registry data release).
- eMoov then applied this subdued rate of growth to the current average house price on a monthly basis up until 2027 to obtain the new average house price.
- They then calculated the total percentage difference between the current and future average house price in order to rank each city based on the highest total growth rate (although this also corresponds with the average monthly increase).
Selling your home? We can help!
✓ Avoid common pitfalls
✓ Make informed decisions
✓ Save yourself money